


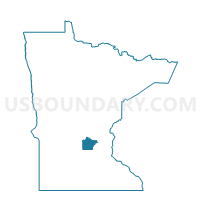
Census Tract 1001, Wright County, Minnesota
About
Outline

Summary
| Unique Area Identifier | 468013 |
| Name | Census Tract 1001 |
| County | Wright County |
| State | Minnesota |
| Area (square miles) | 28.39 |
| Land Area (square miles) | 27.51 |
| Water Area (square miles) | 0.87 |
| % of Land Area | 96.92 |
| % of Water Area | 3.08 |
| Latitude of the Internal Point | 45.26061800 |
| Longtitude of the Internal Point | -93.62876220 |
| Total Population | 12,767 |
| Total Housing Units | 4,760 |
| Total Households | 4,479 |
| Median Age | 31.9 |
Maps

Graphs
Select a template below for downloading or customizing gragh for Census Tract 1001, Wright County, Minnesota


Neighbors
Neighoring Census Tract (by Name) Neighboring Census Tract on the Map
- Census Tract 1002.02, Wright County, MN
- Census Tract 1002.04, Wright County, MN
- Census Tract 1008.01, Wright County, MN
- Census Tract 1008.02, Wright County, MN
- Census Tract 269.10, Hennepin County, MN
- Census Tract 304.02, Sherburne County, MN
- Census Tract 305.02, Sherburne County, MN
- Census Tract 305.03, Sherburne County, MN
Top 10 Neighboring County Subdivision (by Population) Neighboring County Subdivision on the Map
- Elk River city, Sherburne County, MN (22,974)
- St. Michael city, Wright County, MN (16,399)
- Otsego city, Wright County, MN (13,571)
- Big Lake township, Sherburne County, MN (7,386)
- Albertville city, Wright County, MN (7,044)
- Dayton city, Hennepin County, MN (4,617)
- Monticello township, Wright County, MN (3,181)
Top 10 Neighboring Place (by Population) Neighboring Place on the Map
- Elk River city, MN (22,974)
- St. Michael city, MN (16,399)
- Otsego city, MN (13,571)
- Albertville city, MN (7,044)
- Dayton city, MN (4,671)
Top 10 Neighboring Unified School District (by Population) Neighboring Unified School District on the Map
- Elk River Public School District, MN (66,807)
- St. Michael-Albertville School District, MN (22,468)
- Monticello Public School District, MN (20,466)
- Big Lake Public School District, MN (17,276)
Top 10 Neighboring State Legislative District Lower Chamber (by Population) Neighboring State Legislative District Lower Chamber on the Map
- State House District 19B, MN (59,068)
- State House District 32A, MN (55,517)
- State House District 16B, MN (52,029)
- State House District 19A, MN (47,384)
- State House District 48A, MN (45,476)
Top 10 Neighboring State Legislative District Upper Chamber (by Population) Neighboring State Legislative District Upper Chamber on the Map
- State Senate District 19, MN (106,452)
- State Senate District 16, MN (95,820)
- State Senate District 32, MN (90,959)
- State Senate District 48, MN (86,286)
Top 10 Neighboring 111th Congressional District (by Population) Neighboring 111th Congressional District on the Map
Top 10 Neighboring 5-Digit ZIP Code Tabulation Area (by Population) Neighboring 5-Digit ZIP Code Tabulation Area on the Map
- 55330, MN (36,440)
- 55309, MN (18,208)
- 55362, MN (18,089)
- 55376, MN (16,242)
- 55374, MN (13,576)
- 55301, MN (10,535)
- 55327, MN (3,478)
Data
Demographic, Population, Households, and Housing Units
** Data sources from census 2010 **
Show Data on Map
Download Full List as CSV
Download Quick Sheet as CSV
| Subject | This Area | Wright County | Minnesota | National |
|---|---|---|---|---|
| POPULATION | ||||
| Total Population Map | 12,767 | 124,700 | 5,303,925 | 308,745,538 |
| POPULATION, HISPANIC OR LATINO ORIGIN | ||||
| Not Hispanic or Latino Map | 12,455 | 121,648 | 5,053,667 | 258,267,944 |
| Hispanic or Latino Map | 312 | 3,052 | 250,258 | 50,477,594 |
| POPULATION, RACE | ||||
| White alone Map | 11,899 | 118,518 | 4,524,062 | 223,553,265 |
| Black or African American alone Map | 233 | 1,328 | 274,412 | 38,929,319 |
| American Indian and Alaska Native alone Map | 56 | 419 | 60,916 | 2,932,248 |
| Asian alone Map | 217 | 1,478 | 214,234 | 14,674,252 |
| Native Hawaiian and Other Pacific Islander alone Map | 18 | 44 | 2,156 | 540,013 |
| Some Other Race alone Map | 91 | 1,007 | 103,000 | 19,107,368 |
| Two or More Races Map | 253 | 1,906 | 125,145 | 9,009,073 |
| POPULATION, SEX | ||||
| Male Map | 6,473 | 62,622 | 2,632,132 | 151,781,326 |
| Female Map | 6,294 | 62,078 | 2,671,793 | 156,964,212 |
| POPULATION, AGE (18 YEARS) | ||||
| 18 years and over Map | 8,843 | 87,339 | 4,019,862 | 234,564,071 |
| Under 18 years | 3,924 | 37,361 | 1,284,063 | 74,181,467 |
| POPULATION, AGE | ||||
| Under 5 years | 1,233 | 10,699 | 355,504 | 20,201,362 |
| 5 to 9 years | 1,123 | 10,822 | 355,536 | 20,348,657 |
| 10 to 14 years | 1,049 | 10,048 | 352,342 | 20,677,194 |
| 15 to 17 years | 519 | 5,792 | 220,681 | 12,954,254 |
| 18 and 19 years | 216 | 2,622 | 147,148 | 9,086,089 |
| 20 years | 99 | 1,021 | 72,732 | 4,519,129 |
| 21 years | 113 | 1,035 | 70,594 | 4,354,294 |
| 22 to 24 years | 435 | 3,559 | 212,325 | 12,712,576 |
| 25 to 29 years | 1,140 | 8,143 | 372,686 | 21,101,849 |
| 30 to 34 years | 1,219 | 9,353 | 342,900 | 19,962,099 |
| 35 to 39 years | 1,083 | 9,436 | 328,190 | 20,179,642 |
| 40 to 44 years | 1,025 | 9,765 | 352,904 | 20,890,964 |
| 45 to 49 years | 891 | 10,032 | 406,203 | 22,708,591 |
| 50 to 54 years | 734 | 8,481 | 401,695 | 22,298,125 |
| 55 to 59 years | 634 | 6,630 | 349,589 | 19,664,805 |
| 60 and 61 years | 227 | 2,204 | 120,761 | 7,113,727 |
| 62 to 64 years | 284 | 3,124 | 159,014 | 9,704,197 |
| 65 and 66 years | 149 | 1,724 | 86,158 | 5,319,902 |
| 67 to 69 years | 175 | 2,294 | 116,412 | 7,115,361 |
| 70 to 74 years | 188 | 2,884 | 151,857 | 9,278,166 |
| 75 to 79 years | 114 | 2,023 | 122,114 | 7,317,795 |
| 80 to 84 years | 75 | 1,506 | 99,916 | 5,743,327 |
| 85 years and over | 42 | 1,503 | 106,664 | 5,493,433 |
| MEDIAN AGE BY SEX | ||||
| Both sexes Map | 31.90 | 34.60 | 37.40 | 37.20 |
| Male Map | 32.00 | 34.30 | 36.30 | 35.80 |
| Female Map | 31.80 | 35.00 | 38.40 | 38.50 |
| HOUSEHOLDS | ||||
| Total Households Map | 4,479 | 44,473 | 2,087,227 | 116,716,292 |
| HOUSEHOLDS, HOUSEHOLD TYPE | ||||
| Family households: Map | 3,345 | 33,066 | 1,349,015 | 77,538,296 |
| Husband-wife family Map | 2,791 | 27,380 | 1,060,509 | 56,510,377 |
| Other family: Map | 554 | 5,686 | 288,506 | 21,027,919 |
| Male householder, no wife present Map | 222 | 2,068 | 89,707 | 5,777,570 |
| Female householder, no husband present Map | 332 | 3,618 | 198,799 | 15,250,349 |
| Nonfamily households: Map | 1,134 | 11,407 | 738,212 | 39,177,996 |
| Householder living alone Map | 817 | 8,979 | 584,008 | 31,204,909 |
| Householder not living alone Map | 317 | 2,428 | 154,204 | 7,973,087 |
| HOUSEHOLDS, HISPANIC OR LATINO ORIGIN OF HOUSEHOLDER | ||||
| Not Hispanic or Latino householder: Map | 4,413 | 43,807 | 2,027,489 | 103,254,926 |
| Hispanic or Latino householder: Map | 66 | 666 | 59,738 | 13,461,366 |
| HOUSEHOLDS, RACE OF HOUSEHOLDER | ||||
| Householder who is White alone | 4,297 | 43,168 | 1,870,205 | 89,754,352 |
| Householder who is Black or African American alone | 61 | 337 | 90,187 | 14,129,983 |
| Householder who is American Indian and Alaska Native alone | 13 | 129 | 19,078 | 939,707 |
| Householder who is Asian alone | 52 | 338 | 57,475 | 4,632,164 |
| Householder who is Native Hawaiian and Other Pacific Islander alone | 4 | 11 | 603 | 143,932 |
| Householder who is Some Other Race alone | 19 | 229 | 24,853 | 4,916,427 |
| Householder who is Two or More Races | 33 | 261 | 24,826 | 2,199,727 |
| HOUSEHOLDS, HOUSEHOLD TYPE BY HOUSEHOLD SIZE | ||||
| Family households: Map | 3,345 | 33,066 | 1,349,015 | 77,538,296 |
| 2-person household Map | 1,164 | 12,460 | 602,770 | 31,882,616 |
| 3-person household Map | 764 | 7,196 | 289,028 | 17,765,829 |
| 4-person household Map | 824 | 7,816 | 265,265 | 15,214,075 |
| 5-person household Map | 392 | 3,634 | 119,947 | 7,411,997 |
| 6-person household Map | 129 | 1,267 | 43,372 | 3,026,278 |
| 7-or-more-person household Map | 72 | 693 | 28,633 | 2,237,501 |
| Nonfamily households: Map | 1,134 | 11,407 | 738,212 | 39,177,996 |
| 1-person household Map | 817 | 8,979 | 584,008 | 31,204,909 |
| 2-person household Map | 271 | 2,012 | 121,616 | 6,360,012 |
| 3-person household Map | 29 | 274 | 18,766 | 992,156 |
| 4-person household Map | 10 | 100 | 9,356 | 411,171 |
| 5-person household Map | 4 | 24 | 3,055 | 126,634 |
| 6-person household Map | 2 | 14 | 886 | 48,421 |
| 7-or-more-person household Map | 1 | 4 | 525 | 34,693 |
| HOUSING UNITS | ||||
| Total Housing Units Map | 4,760 | 49,000 | 2,347,201 | 131,704,730 |
| HOUSING UNITS, OCCUPANCY STATUS | ||||
| Occupied Map | 4,479 | 44,473 | 2,087,227 | 116,716,292 |
| Vacant Map | 281 | 4,527 | 259,974 | 14,988,438 |
| HOUSING UNITS, OCCUPIED, TENURE | ||||
| Owned with a mortgage or a loan Map | 3,542 | 30,079 | 1,109,405 | 52,979,430 |
| Owned free and clear Map | 546 | 7,077 | 414,454 | 23,006,644 |
| Renter occupied Map | 391 | 7,317 | 563,368 | 40,730,218 |
| HOUSING UNITS, VACANT, VACANCY STATUS | ||||
| For rent Map | 14 | 578 | 48,091 | 4,137,567 |
| Rented, not occupied Map | 0 | 40 | 3,198 | 206,825 |
| For sale only Map | 89 | 767 | 30,726 | 1,896,796 |
| Sold, not occupied Map | 17 | 129 | 6,232 | 421,032 |
| For seasonal, recreational, or occasional use Map | 97 | 2,406 | 130,471 | 4,649,298 |
| For migrant workers Map | 0 | 1 | 334 | 24,161 |
| Other vacant Map | 64 | 606 | 40,922 | 3,652,759 |
| HOUSING UNITS, OCCUPIED, AVERAGE HOUSEHOLD SIZE BY TENURE | ||||
| Total: Map | 2.85 | 2.78 | 2.48 | 2.58 |
| Owner occupied Map | 2.82 | 2.87 | 2.59 | 2.65 |
| Renter occupied Map | 3.10 | 2.34 | 2.16 | 2.44 |
| HOUSING UNITS, OCCUPIED, TENURE BY RACE OF HOUSEHOLDER | ||||
| Owner occupied: Map | 4,088 | 37,156 | 1,523,859 | 75,986,074 |
| Householder who is White alone Map | 3,944 | 36,245 | 1,437,173 | 63,446,275 |
| Householder who is Black or African American alone Map | 43 | 222 | 22,968 | 6,261,464 |
| Householder who is American Indian and Alaska Native alone Map | 10 | 79 | 9,155 | 509,588 |
| Householder who is Asian alone Map | 49 | 265 | 32,562 | 2,688,861 |
| Householder who is Native Hawaiian and Other Pacific Islander alone Map | 3 | 8 | 308 | 61,911 |
| Householder who is Some Other Race alone Map | 12 | 151 | 9,816 | 1,975,817 |
| Householder who is Two or More Races Map | 27 | 186 | 11,877 | 1,042,158 |
| Renter occupied: Map | 391 | 7,317 | 563,368 | 40,730,218 |
| Householder who is White alone Map | 353 | 6,923 | 433,032 | 26,308,077 |
| Householder who is Black or African American alone Map | 18 | 115 | 67,219 | 7,868,519 |
| Householder who is American Indian and Alaska Native alone Map | 3 | 50 | 9,923 | 430,119 |
| Householder who is Asian alone Map | 3 | 73 | 24,913 | 1,943,303 |
| Householder who is Native Hawaiian and Other Pacific Islander alone Map | 1 | 3 | 295 | 82,021 |
| Householder who is Some Other Race alone Map | 7 | 78 | 15,037 | 2,940,610 |
| Householder who is Two or More Races Map | 6 | 75 | 12,949 | 1,157,569 |
| HOUSING UNITS, OCCUPIED, TENURE BY HISPANIC OR LATINO ORIGIN OF HOUSEHOLDER | ||||
| Owner occupied: Map | 4,088 | 37,156 | 1,523,859 | 75,986,074 |
| Not Hispanic or Latino householder Map | 4,033 | 36,704 | 1,497,368 | 69,617,625 |
| Hispanic or Latino householder Map | 55 | 452 | 26,491 | 6,368,449 |
| Renter occupied: Map | 391 | 7,317 | 563,368 | 40,730,218 |
| Not Hispanic or Latino householder Map | 380 | 7,103 | 530,121 | 33,637,301 |
| Hispanic or Latino householder Map | 11 | 214 | 33,247 | 7,092,917 |
| HOUSING UNITS, OCCUPIED, TENURE BY HOUSEHOLD SIZE | ||||
| Owner occupied: Map | 4,088 | 37,156 | 1,523,859 | 75,986,074 |
| 1-person household Map | 745 | 6,102 | 329,955 | 16,453,569 |
| 2-person household Map | 1,341 | 12,714 | 581,481 | 27,618,605 |
| 3-person household Map | 717 | 6,337 | 236,596 | 12,517,563 |
| 4-person household Map | 756 | 7,054 | 224,564 | 10,998,793 |
| 5-person household Map | 354 | 3,244 | 98,018 | 5,057,765 |
| 6-person household Map | 116 | 1,100 | 33,229 | 1,965,796 |
| 7-or-more-person household Map | 59 | 605 | 20,016 | 1,373,983 |
| Renter occupied: Map | 391 | 7,317 | 563,368 | 40,730,218 |
| 1-person household Map | 72 | 2,877 | 254,053 | 14,751,340 |
| 2-person household Map | 94 | 1,758 | 142,905 | 10,624,023 |
| 3-person household Map | 76 | 1,133 | 71,198 | 6,240,422 |
| 4-person household Map | 78 | 862 | 50,057 | 4,626,453 |
| 5-person household Map | 42 | 414 | 24,984 | 2,480,866 |
| 6-person household Map | 15 | 181 | 11,029 | 1,108,903 |
| 7-or-more-person household Map | 14 | 92 | 9,142 | 898,211 |
Loading...